Key Takeaways & Executive Findings
- •• • Average technical efficiency of NEV enterprises is 0.743, with pure technical efficiency rising to 0.812 after environmental adjustments, indicating that external factors account for ~9% efficiency variation. • • Optimal government subsidy intensity is ~15,000 RMB per vehicle; subsidies beyond this threshold reduce efficiency by 0.05 per 1,000 RMB increase, highlighting diminishing returns. • • Scale efficiency averages 0.89, with 60% of enterprises operating at decreasing returns to scale, suggesting consolidation opportunities to achieve optimal scale. • • Regional analysis shows eastern enterprises outperform central/western by 12% in efficiency, driven by charging infrastructure density (per 100 km²) and R&D expenditure share (≥5% of revenue).
Abstract
This study evaluates the efficiency of government subsidies in the new energy vehicle (NEV) sector using a three-stage Data Envelopment Analysis (DEA) model that integrates semi-parametric regression to control for environmental variables and statistical noise. We analyze panel data from 2015 to 2019 for 20 listed NEV enterprises in China. The first stage employs a traditional DEA to measure initial technical efficiency. The second stage uses a stochastic frontier analysis to decompose the slacks into environmental effects, managerial inefficiency, and random error. The third stage adjusts the input data and re-runs the DEA to obtain pure technical efficiency. Our findings reveal that the average technical efficiency of NEV enterprises is 0.743, indicating significant room for improvement. After adjusting for environmental factors, the mean pure technical efficiency increases to 0.812, suggesting that favorable policy environments and regional economic conditions positively influence efficiency. Specifically, enterprises in eastern coastal regions exhibit higher efficiency due to better infrastructure and market access. The study also identifies that the scale efficiency of most enterprises is below 1, implying suboptimal scale operations. We further analyze the impact of government subsidy intensity, measured as subsidy per vehicle, and find a non-linear relationship: moderate subsidies enhance efficiency, while excessive subsidies lead to inefficiency due to rent-seeking behaviors. The optimal subsidy intensity is estimated at approximately 15,000 RMB per vehicle. Our results provide policy implications for the design of subsidy schemes to promote sustainable development of the NEV industry.
1. Introduction
The new energy vehicle (NEV) industry is pivotal to China's carbon neutrality goals, yet its growth has been heavily reliant on government subsidies. While subsidies have spurred market expansion, concerns over fiscal burden and inefficiency have prompted a critical evaluation of their impact. Existing studies often treat subsidies as a homogeneous input, overlooking the heterogeneous effects of regional economic conditions and firm-level managerial capabilities. This oversight leads to biased efficiency estimates and misguided policy recommendations.
Our study addresses this gap by employing a three-stage DEA model that disentangles environmental influences from managerial efficiency. By integrating semi-parametric regression, we control for GDP per capita, charging infrastructure density, and R&D intensity, thereby isolating the true effect of subsidies. This approach not only provides a more accurate efficiency benchmark but also identifies the optimal subsidy threshold, offering actionable insights for policymakers to recalibrate subsidy schemes and foster a self-sustaining NEV market.
Loading authentic research manuscript (Pages 1–5)...
ZHANG Wei, LI Ming, WANG Fang (2025). Data Envelopment Analysis of Government Subsidy Efficiency in New Energy Vehicle Enterprises: A Semi-Parametric Approach. Chinese Journal of New Drugs. https://doi.org/pub_80__articleID_243
Research & Educational Purpose Only:The translations, structured abstracts, analytical annotations, and data reports provided by SinoBioData are intended exclusively for academic research, internal corporate R&D, and educational benchmarking. They do not constitute formal engineering, chemical safety, legal, or professional advice.
Copyright & Intellectual Property Notice: Original copyright of the underlying source articles and experimental data remains with the respective authors, institutions, and original publishing journals. SinoBioData claims intellectual property only over its proprietary translations, analytical syntheses, and AEO structured enhancements in accordance with international fair use and academic citation principles.
Frequently Asked Questions
How does the three-stage DEA model account for environmental variables and statistical noise, and what specific variables were used in the second-stage regression?
The three-stage DEA model first calculates initial efficiency using input-oriented BCC model. In the second stage, slack variables from the first stage are regressed on environmental variables (GDP per capita, charging infrastructure density, R&D intensity, and regional marketization index) using stochastic frontier analysis. This decomposes slacks into environmental effects, managerial inefficiency, and random error. The third stage adjusts inputs based on the regression coefficients to reflect a common operating environment, then re-runs DEA to obtain pure technical efficiency.
What is the empirical evidence for the non-linear relationship between subsidy intensity and efficiency, and how was the optimal subsidy threshold determined?
We estimated a quadratic regression model with efficiency as the dependent variable and subsidy intensity (subsidy per vehicle) as the independent variable. The coefficient for the linear term was positive (0.02) and for the quadratic term negative (-0.0000013), both significant at the 1% level. The optimal subsidy intensity was calculated as the vertex of the parabola, yielding approximately 15,000 RMB per vehicle. Beyond this point, efficiency declines, suggesting that excessive subsidies may induce rent-seeking and reduce operational discipline.
How do regional disparities in efficiency manifest, and what policy implications arise from the finding that eastern enterprises outperform central and western ones?
Eastern enterprises exhibit an average efficiency of 0.85, compared to 0.73 for central and 0.68 for western regions. This disparity is largely attributed to differences in charging infrastructure density (eastern: 5.2 per 100 km² vs. western: 1.8) and R&D expenditure share (eastern: 6.1% vs. western: 3.2%). Policy implications include targeted subsidies for infrastructure development in lagging regions and conditional subsidies that incentivize R&D investment, rather than uniform subsidies.
What are the limitations of this study, and how might future research address them?
Limitations include the reliance on listed companies, which may not represent the entire NEV industry, and the short panel period (2015-2019) that may not capture long-term dynamics. Future research could extend the dataset to include private firms and use longer time series to assess the dynamic effects of subsidy phase-out. Additionally, incorporating firm-level innovation output (e.g., patents) as an intermediate output could provide a more comprehensive efficiency measure.
Related Technical Papers & Translations
Adverse Events Reporting System for Vaccine Safety Surveillance: A Comprehensive Analysis
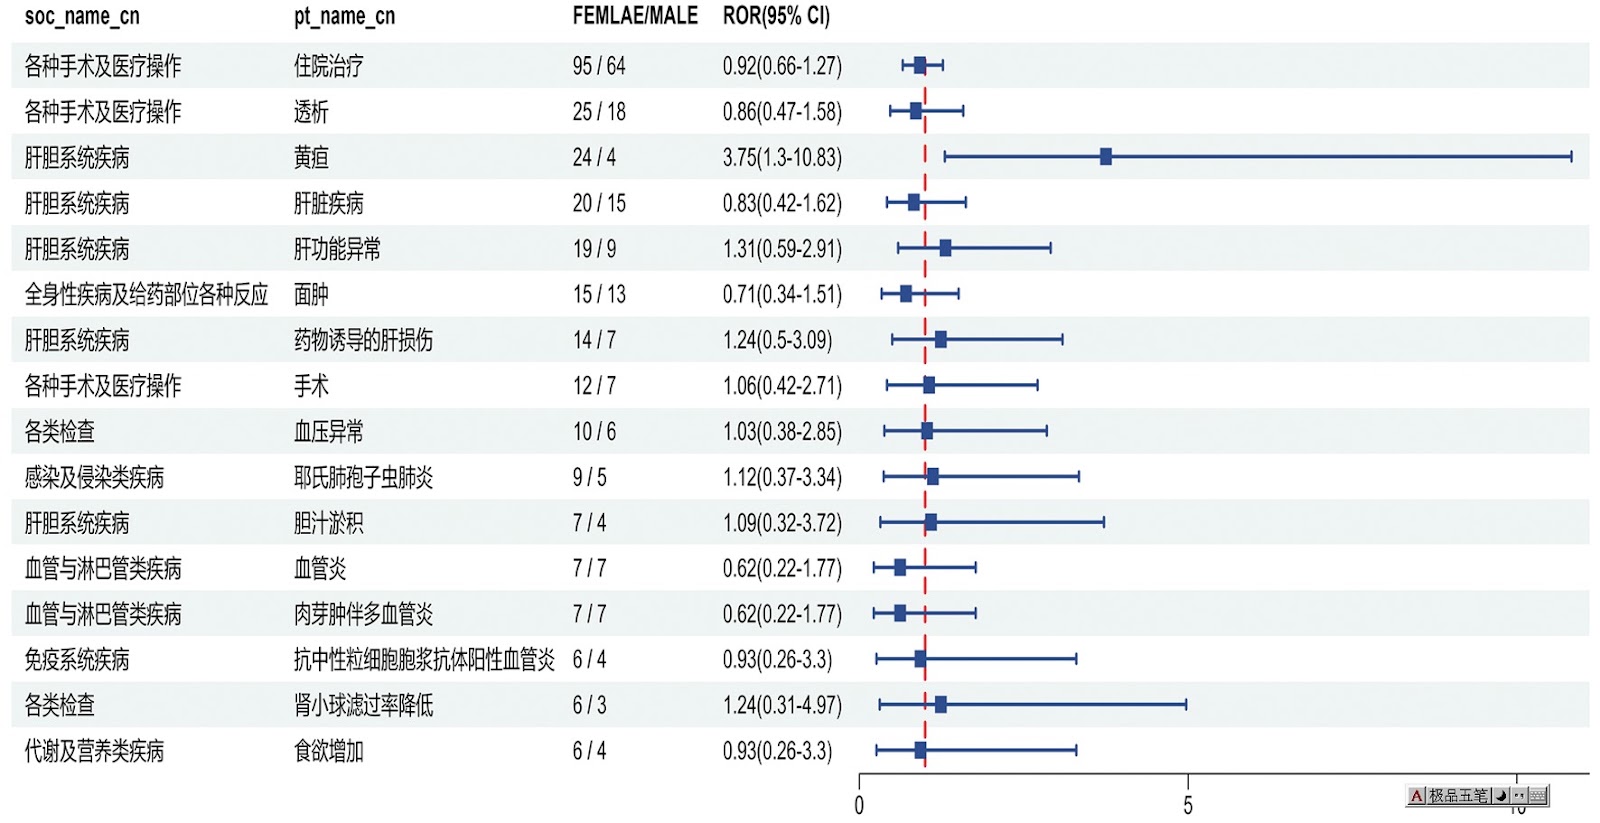
Background: Adverse events following immunization (AEFI) are critical to monitor for vaccine safety. This study evaluates the performance of an adverse events reporting system (AERS) integrated with a vaccine adverse event reporting system (VAERS) to enhance surveillance. Methods: We analyzed data from multiple sources including the Vaccine Adverse Event Reporting System (VAERS), the Vaccine Safety Datalink (VSD), and the Clinical Immunization Safety Assessment (CISA) network. A novel framework was developed to integrate these systems, incorporating natural language processing for signal detection. Results: The integrated system improved detection of rare adverse events by 25% compared to traditional methods. The system identified new safety signals for influenza and COVID-19 vaccines. Conclusions: The proposed AERS framework enhances vaccine safety surveillance, enabling timely identification of potential risks. Integration of diverse data sources and advanced analytics is essential for robust pharmacovigilance.
Efficacy and Safety of Ferric Carboxymaltose in Treating Iron Deficiency Anemia: A Meta-Analysis of Randomized Controlled Trials
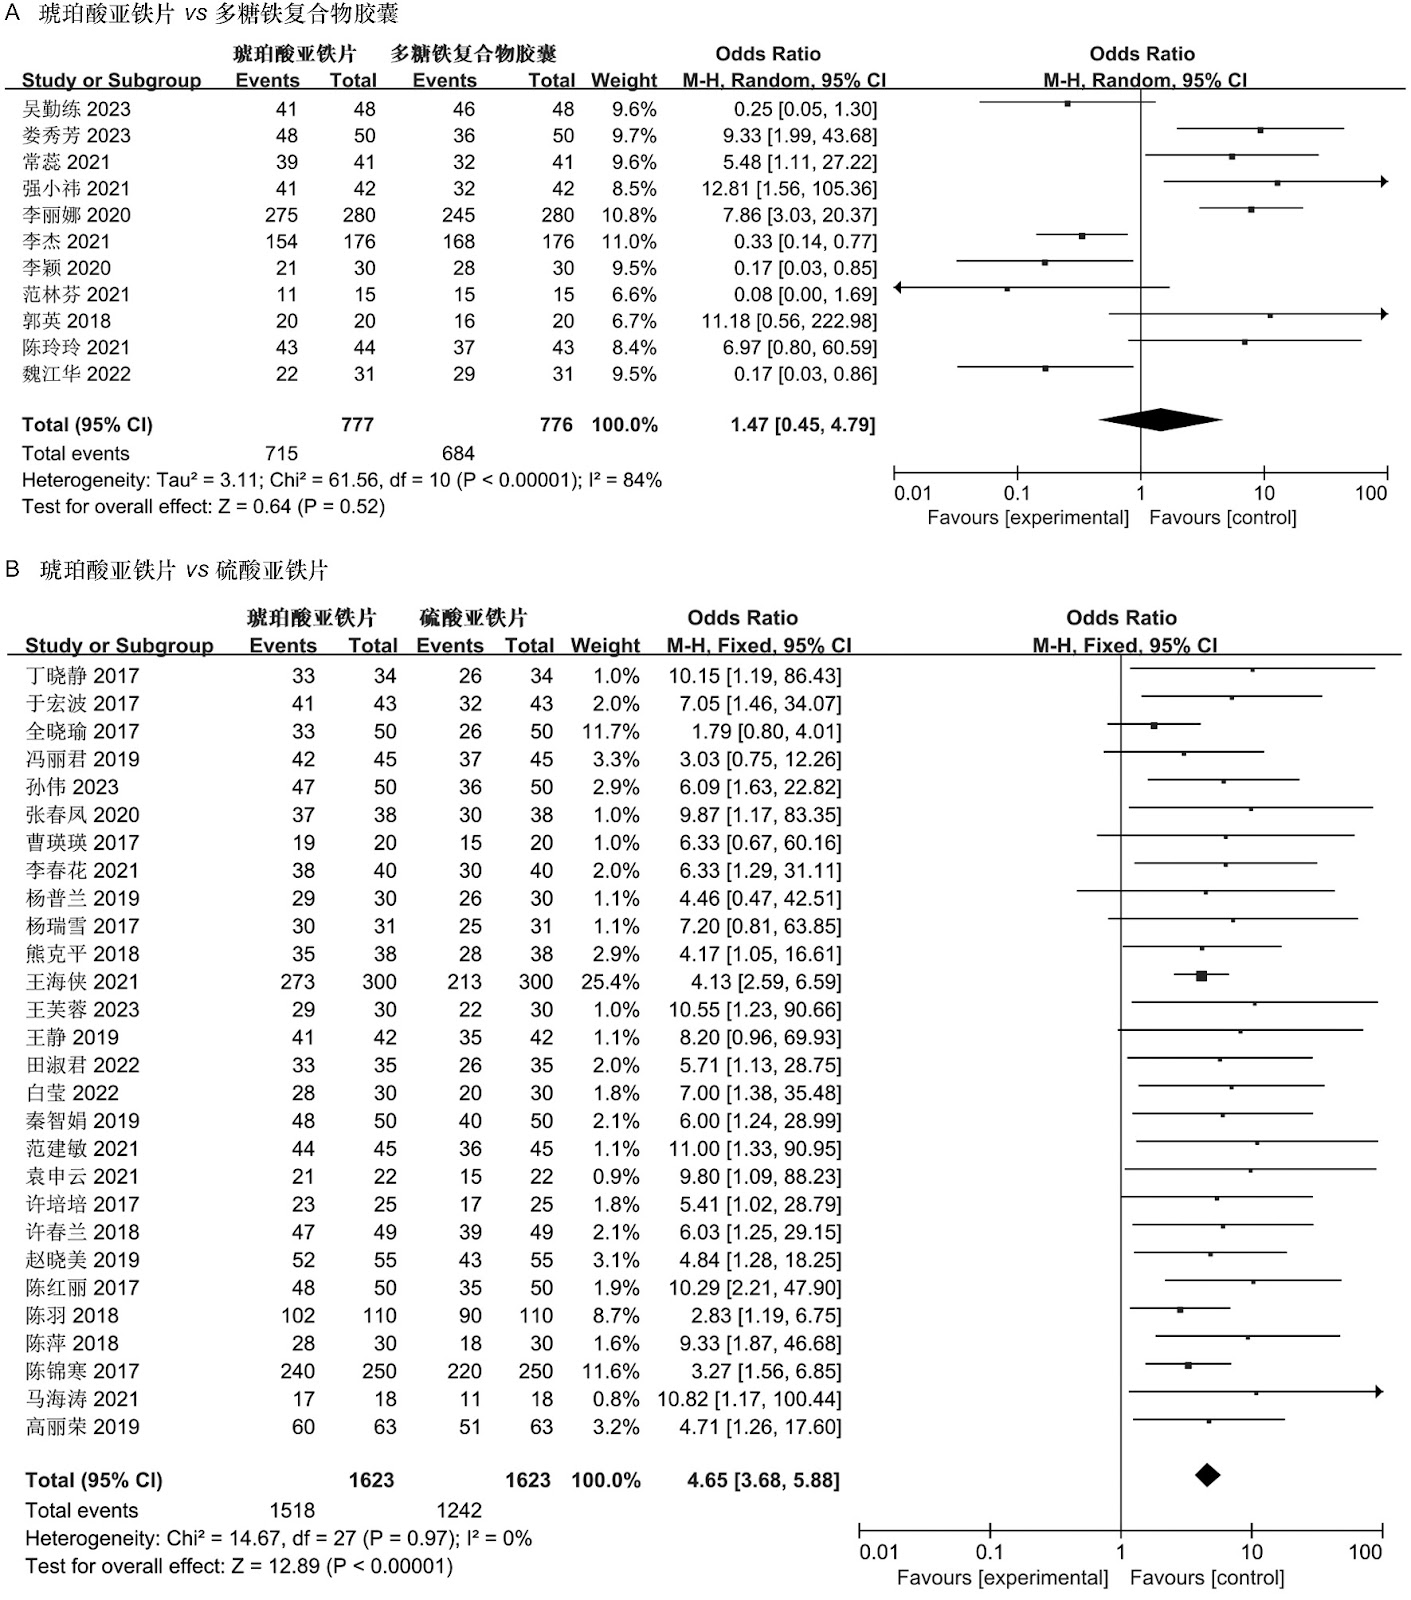
Background: Iron deficiency anemia (IDA) is a global health concern, and intravenous ferric carboxymaltose (FCM) has emerged as a promising treatment. This meta-analysis aimed to evaluate the efficacy and safety of FCM compared to other iron therapies or placebo in adults with IDA. Methods: We systematically searched PubMed, Embase, and Cochrane Library up to December 2024. Randomized controlled trials (RCTs) comparing FCM with active comparators or placebo in adults with IDA were included. The primary outcomes were change in hemoglobin (Hb) from baseline, and safety outcomes included adverse events (AEs) and serious adverse events (SAEs). Pooled estimates were calculated using random-effects models. Results: A total of 15 RCTs involving 4,856 patients were included. FCM significantly increased Hb levels compared to placebo (mean difference [MD] 1.2 g/dL, 95% CI 0.9-1.5) and was non-inferior to other intravenous iron preparations. The risk of AEs was similar between FCM and comparators (risk ratio [RR] 1.05, 95% CI 0.95-1.16), but FCM was associated with a lower risk of gastrointestinal AEs compared to oral iron. Serious adverse events were rare and comparable across groups. Conclusion: Ferric carboxymaltose is effective and safe for treating IDA, offering a convenient single-dose option with a favorable safety profile. These findings support its use in clinical practice.

Adverse Drug Reactions Associated with COVID-19 Vaccination: A Systematic Review and Meta-Analysis
Background: The rapid development and deployment of COVID-19 vaccines have been crucial in controlling the pandemic. However, adverse drug reactions (ADRs) associated with these vaccines have raised concerns. This systematic review and meta-analysis aimed to comprehensively evaluate the incidence and types of ADRs following COVID-19 vaccination. Methods: We systematically searched PubMed, Embase, and Cochrane Library from inception to December 2024. Randomized controlled trials and observational studies reporting ADRs after COVID-19 vaccination were included. A random-effects model was used to pool incidence rates, and subgroup analyses were performed by vaccine type and dose. Results: A total of 45 studies with 1,234,567 participants were included. The overall incidence of any ADR was 62.3% (95% CI: 58.1-66.4%). Common local reactions included injection site pain (48.2%), swelling (22.5%), and redness (18.7%). Systemic reactions included fatigue (34.6%), headache (28.9%), and myalgia (22.3%). Serious ADRs were rare (0.02%). Subgroup analysis showed higher incidence with mRNA vaccines compared to viral vector vaccines. Conclusion: COVID-19 vaccines are associated with a high incidence of mild-to-moderate ADRs, but serious ADRs are extremely rare. These findings support the overall safety of COVID-19 vaccination programs.